Waffle
Waffle at Chick-fil-A. 380 calories, $1.75, 5 g protein.
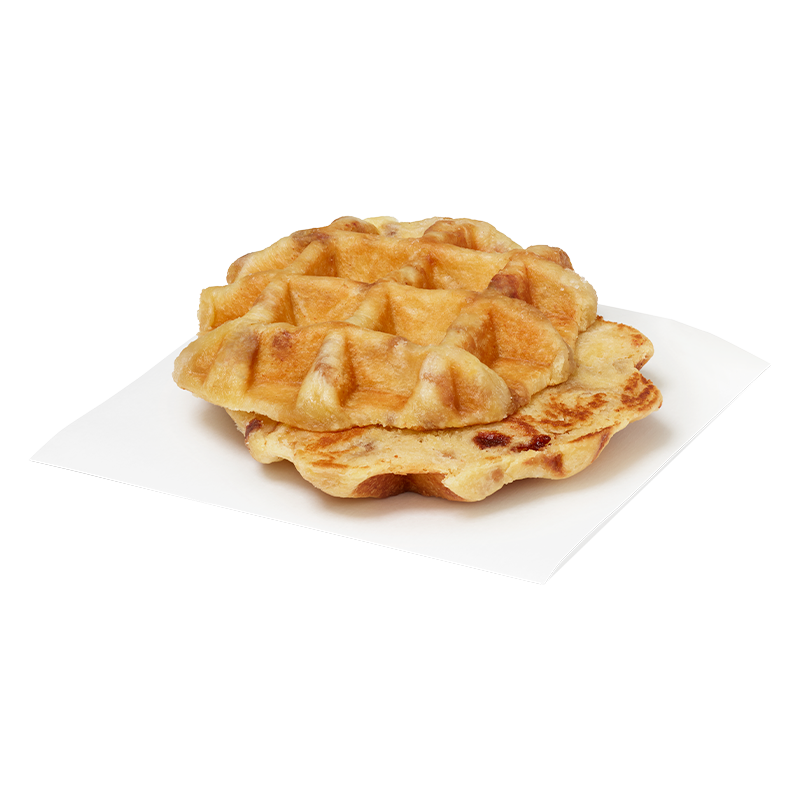
Photograph from Chick-fil-A, as published on its own menu.
How it compares on the Chick-fil-A menu
At 380 calories it is heavier than 59% of the 277 Chick-fil-A items we track, against a menu median of 320. It delivers 1.3 g of protein per 100 calories, 199th of 220 items with published protein. At 217 calories per dollar it is 1st of 205 priced items on value.
Lighter choices at Chick-fil-A
| Item | Calories | Saving |
|---|---|---|
| 4 Ct Chick-fil-A Chick-n-Minis® | 360 | −20 |
| Chick-fil-A Chick-n-Minis® | 360 | −20 |
| Breakfast Waffle | 320 | −60 |
| Bowl of Chicken Noodle Soup | 320 | −60 |
| Frosted Mello Yello® | 320 | −60 |
The same thing at other chains
| Chain | Item | Calories | Nutrient density |
|---|---|---|---|
| McDonald's | Waffle Cone | 150 | — |
| McDonald's | Belgian Waffle | 213 | — |
| McDonald's | Hot Fudge Waffle Cone with Almond | 570 | — |
What a Waffle costs across America
Priced at 2910 Chick-fil-A restaurants in 49 states on the same day. The middle 80% of them charge between $1.65 and $1.99, a spread of 21%.
Each bar is the number of restaurants charging that price, and the gold bar holds the median. The last gathers everything at that price and above, so one distant outlier cannot flatten the rest.
Point at a bar, or tab to it, for the count and the share of restaurants at that price.
The cheapest Waffle in the sample is $1.59 in Rocky Mount, NC, and the most expensive is $2.35 in Los Angeles, CA. Both are single restaurants, which is why the headline above uses the middle 80% instead.
The same map as the rest of the site. Each pin is one restaurant that sells a Waffle. Green is cheap for the brand, red is expensive. Zoom, switch items, or tap Cheapest near me.
Runs in your browser. Your location is not sent anywhere, because there is no server to send it to. The map above is the same one as the rest of the site — tap Cheapest near me there to zoom to your area.
By state, for what it is worth
About half the variation happens between restaurants inside one state, so a state median hides as much as it shows. Of the 46 states with at least three sampled restaurants, these are the four cheapest and the four most expensive — the 38 in between are not listed.
| State | Median | Restaurants | End |
|---|---|---|---|
| AL | $1.65 | 86 | cheapest |
| NC | $1.69 | 168 | cheapest |
| GA | $1.69 | 242 | cheapest |
| TX | $1.69 | 424 | cheapest |
| CA | $2.19 | 215 | most expensive |
| HI | $2.15 | 6 | most expensive |
| DC | $2.09 | 7 | most expensive |
| WA | $1.99 | 30 | most expensive |
What it has cost since we started watching
None of the 3,030 restaurants we price has changed this since 2026-09-05. A typical one charges $1.75.
See every Waffle we price on the map — 2,910 restaurants, one dot each →
Priced like this at Chick-fil-A
The 5 items whose national median sits closest to the Waffle’s $1.75. The spread is the middle 80% of restaurants, so a wide one means the same item costs noticeably different amounts depending where you buy it.
| Item | Median | Spread | Restaurants |
|---|---|---|---|
| Chocolate Chunk Cookie | $1.79 | 14% | 2,918 |
| Small Hash Browns | $1.69 | 21% | 2,778 |
| Chick-fil-A® Icedream® Cup | $1.65 | 28% | 2,900 |
| Buttery Biscuit | $1.65 | 22% | 2,774 |
| Chick-fil-A® Icedream® Cone | $1.89 | 17% | 2,860 |
Full nutrient panel
| Nutrient | Amount |
|---|---|
| Cholesterol | 20 mg |
| Dietary Fiber | 5 g |
| Protein | 5 g |
| Saturated Fat | 7 g |
| Sodium | 330 mg |
| Sugars | 27 g |
| Total Carbohydrate | 52 g |
| Total Fat | 18 g |
| Trans Fat | 0 g |
The nutrition label as Chick-fil-A publishes it for this item, matched to the current menu, alongside the store-level price above.